Industry

Trace losses across stations, processes, and parts

More rework, fluctuating cycle times, or recurring stoppages: Manufacturing Insights helps production and quality staff identify the affected stations, products, and process steps and systematically evaluate potential improvements.

Where data-based analysis helps

Typical symptoms in discrete manufacturing

In discrete production environments, isolated key figures are often not enough. Typical symptoms are high levels of rejects without a clear cause, unstable cycle times, recurring stops or quality problems that cannot be clearly assigned to a station.

Consequently, solutions that not only visualize production data but also compile it into a clear report for root cause analysis and prioritized actions are particularly useful.

Consider line, process and part together

Analysis context

Between the first symptom and the actual measure is the question of how production events, process parameters and quality data can be evaluated together.

Analysis context

Example: A line loses performance on certain variants

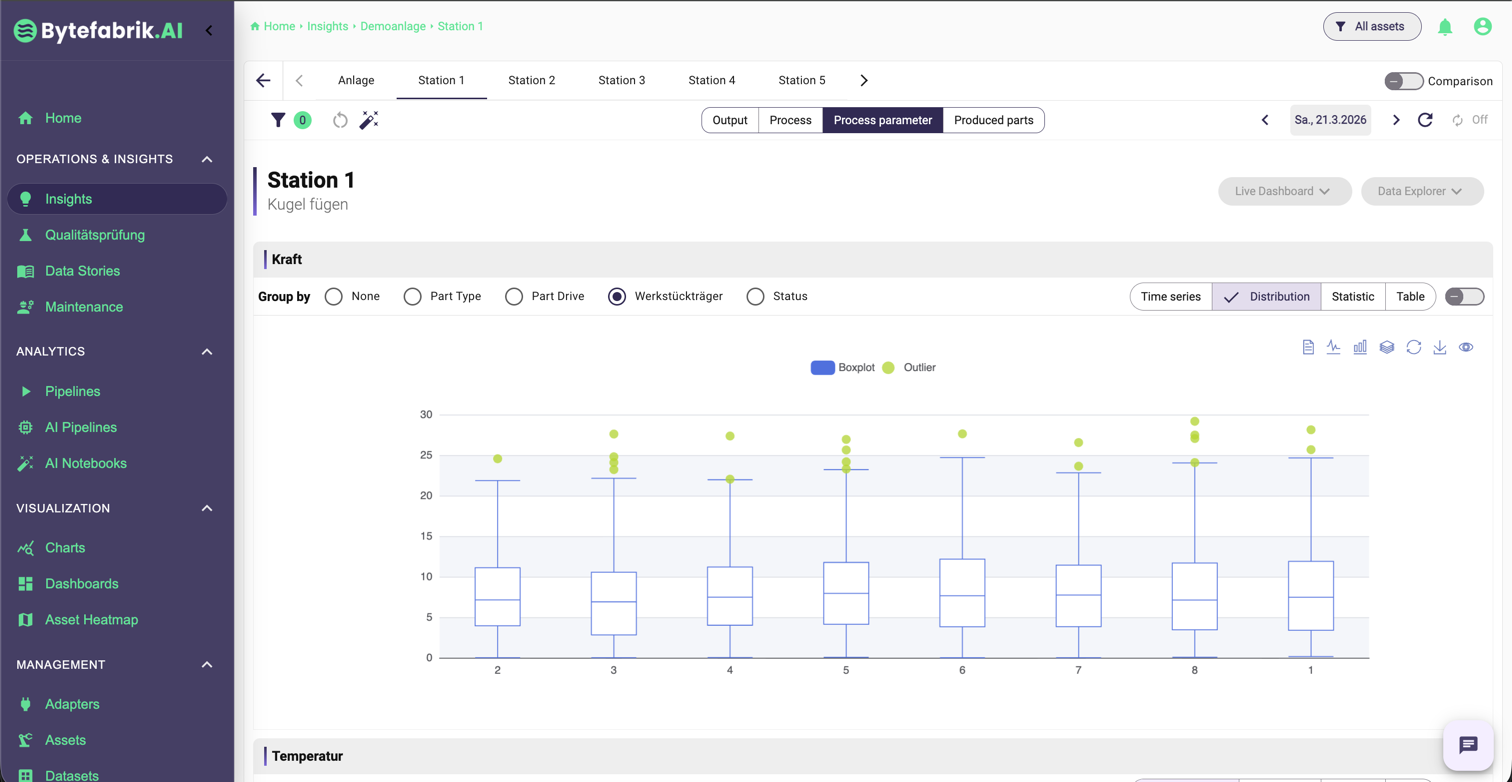
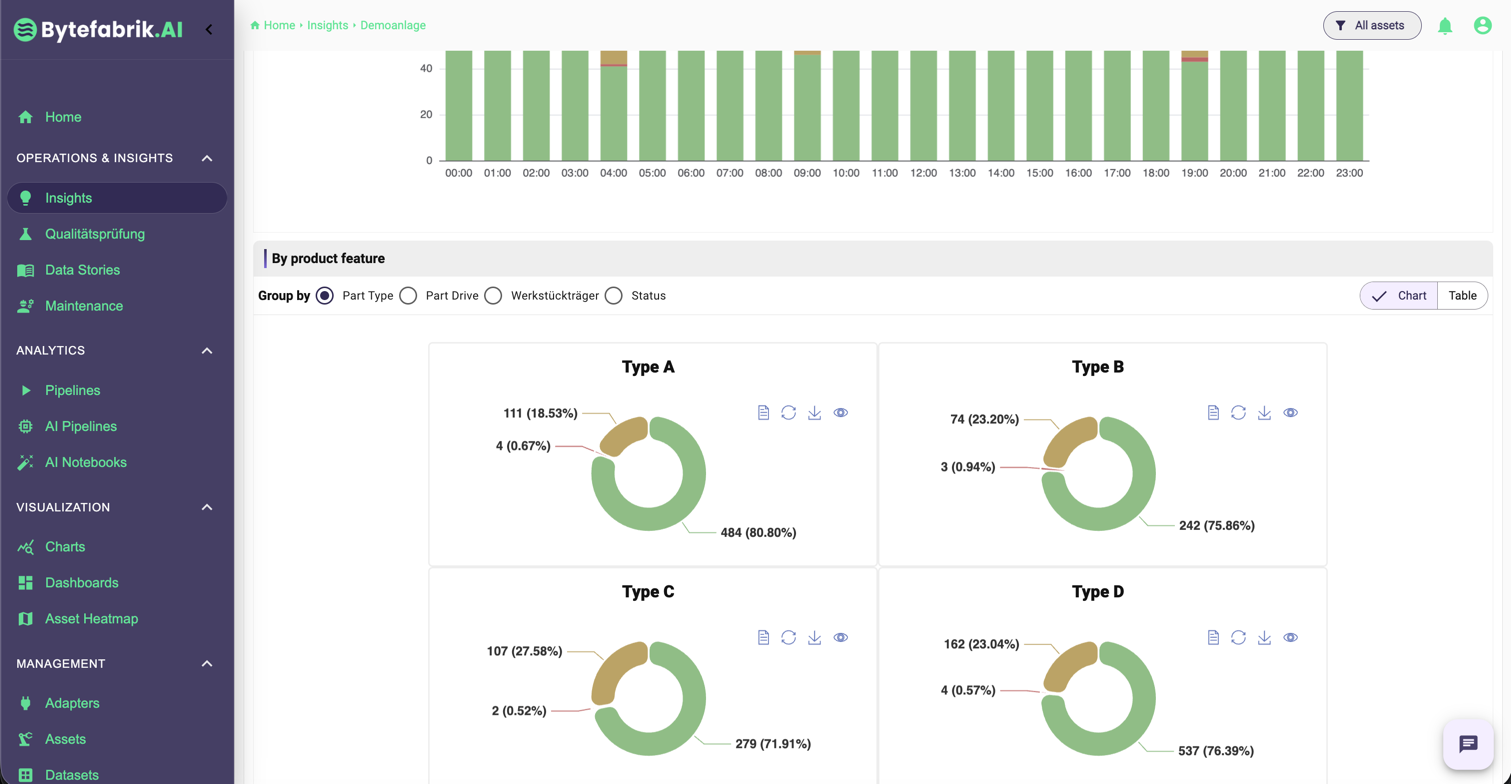
Compare output and cycle times by product and period. Then investigate unusual stations, machine states, and part histories. Process paths reveal where parts are processed again or spend longer waiting between stations.

  • Line and station-related view of throughput and quality
  • Product and Component Traceability for Root Cause Analysis and Traceability
  • Basis for prioritized measures instead of isolated individual key figures
View Manufacturing Insights
Analysis view for discrete manufacturing

Focus of the analysis

These issues often take center stage in discrete manufacturing environments.

Line performance
Throughput & cycle

Detect deviations in cycle time, waiting times and station cycles.

Quality context
IO / NIO / Rework

Link quality events with process data and product reference.

Product reference
Part and batch history

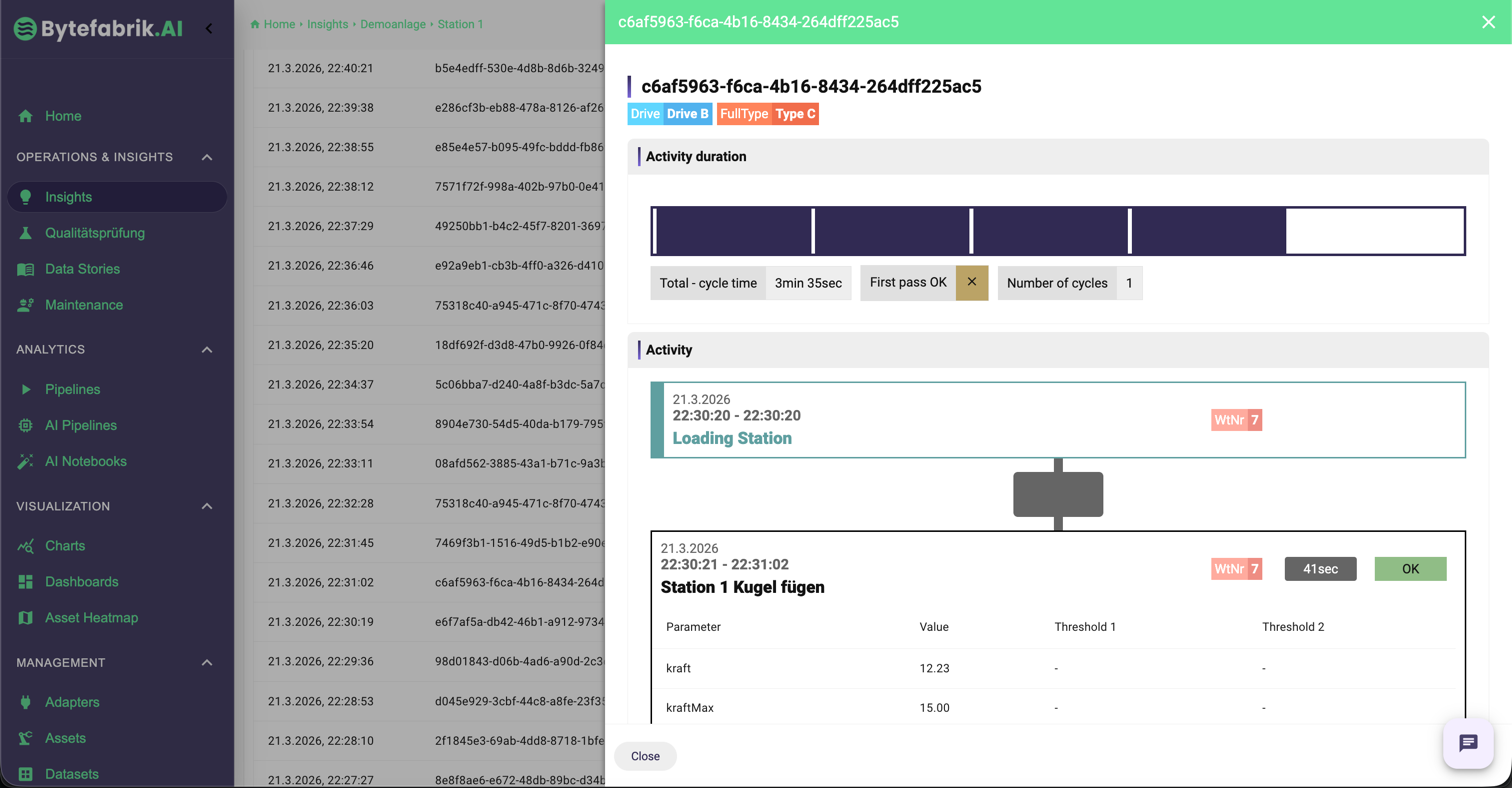
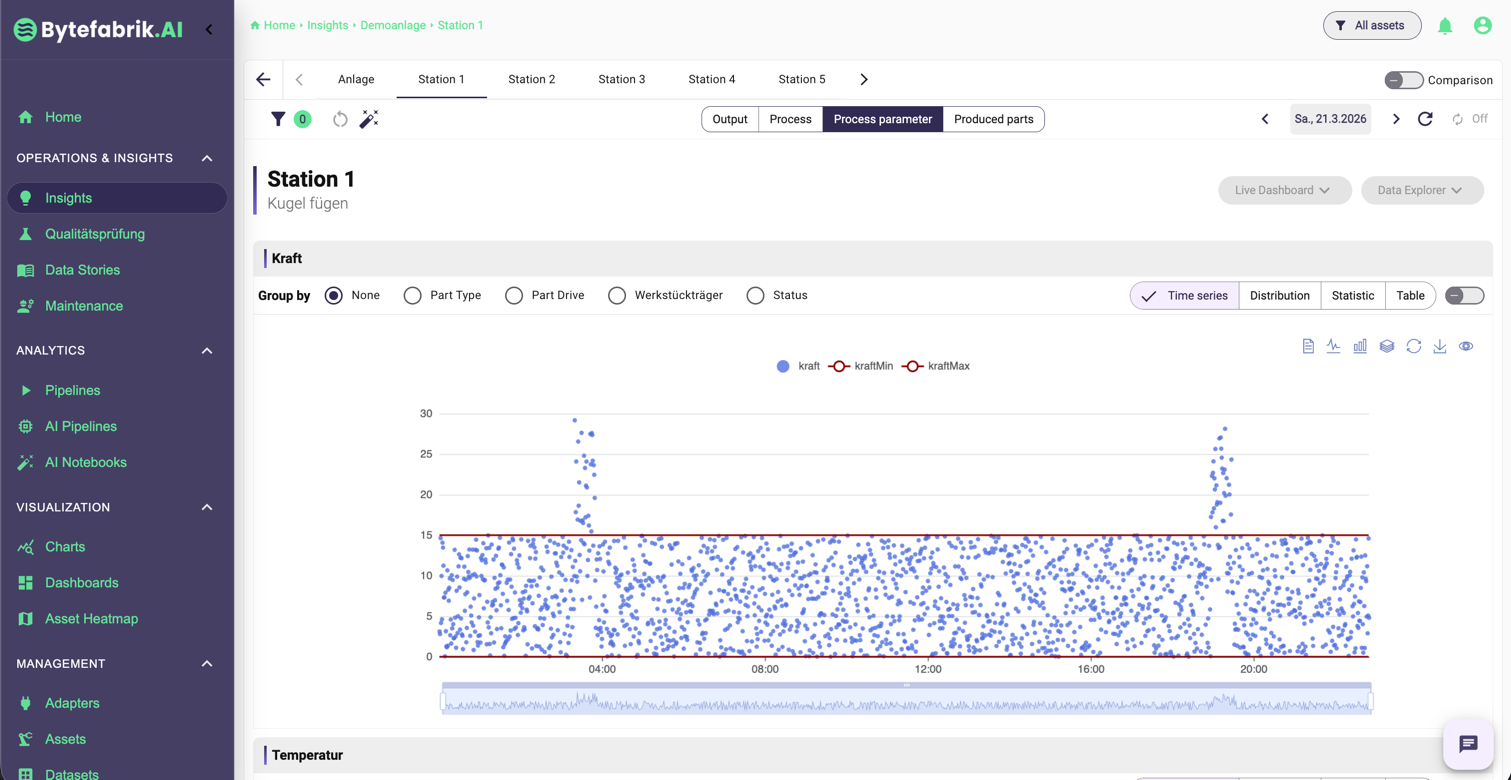
For each part produced, review all data from the station, the process, and the limit values.

Root cause analysis
Error, process, progression

Evaluate recurring patterns not in isolation, but in the production process.

Basis for reliable production analyses

Typically required data

The improvement question determines the required data. In the workshop, we check which states, process values, and product identifiers are available and what information is still missing.

Production System for Status and Event Analyses

Status and event data

Statuses such as processing, automatic operation, stops or station events form the basis for availability and sequence analyses.

Display of Quality-Related Process Parameters

Process parameters

Force, displacement, temperature, torque, tightness or other quality-relevant values make process behavior technically evaluable.

Product and Identification Data in the Parts History

Product and identification data

Product IDs, batches, workpiece carriers or variants allow the linking of process history and quality per part.

Processing and Test Results in the Context of the Process

Processing and test results

IO, NOK and rework information link quality events with the underlying production context.

Existing industrial data sources

What is often already available

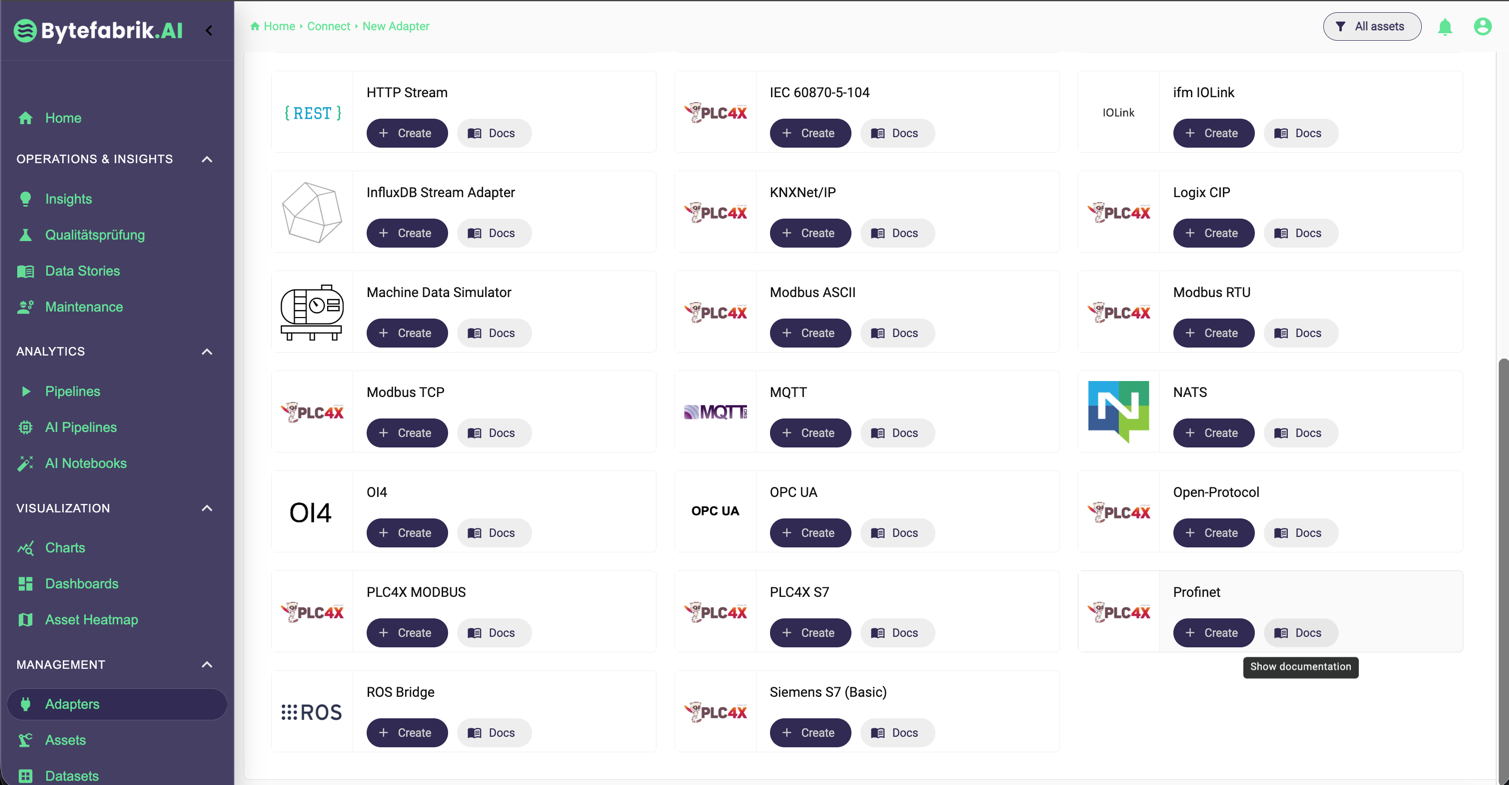
Existing control, process, and quality data allow you to get started right away. You'll be surprised at what your machines are already capable of!

Function modules for different tasks

Manufacturing Insights for your production line

Manufacturing Insights extends the IoT Data Hub with ready-made views for production, processes, errors, and part histories. We configure the required capabilities for your line and improvement question.

Modules for analysis and traceability

These functional areas can be combined within the same platform.

Production Analysis Including Output and Cycle Times
01

Production analysis

For output, cycle times, quality curves and the structured evaluation of line and station data.

View production analysis

Start a pilot with a specific production loss question

For example: Where do rework loops or longer cycle times occur? Within a few days to weeks, we connect a line and configure the appropriate analysis. Scope and data availability determine the timeline.

  1. 01

    Connect the first data sources in a workshop

    We'll work with you to select a system and a specific loss scenario. We'll connect the initial data sources directly during the workshop.

  2. 02

    Configure equipment and analysis views

    We configure the IoT Data Hub and the relevant Manufacturing Insights modules. States, errors, and the required product or process data are mapped.

  3. 03

    Evaluate the use case with your team

    With customized views, you can identify production losses early on. We evaluate the benefits based on the agreed-upon goals.

30-minute product demo

See where a line loses performance

In 30 minutes, we'll track a deviation using output data, station data, and part histories. You'll see what data your team needs for the investigation—no preparation required.

Request a 30-minute demo