
Manufacturing Insights

Tackle the largest production losses first

Which downtime events, quality losses, or slow process steps deserve attention first? Manufacturing Insights helps production managers prioritize losses, pinpoint causes, and compare the impact of corrective actions.

Message analysis

Which messages are behind your downtime?

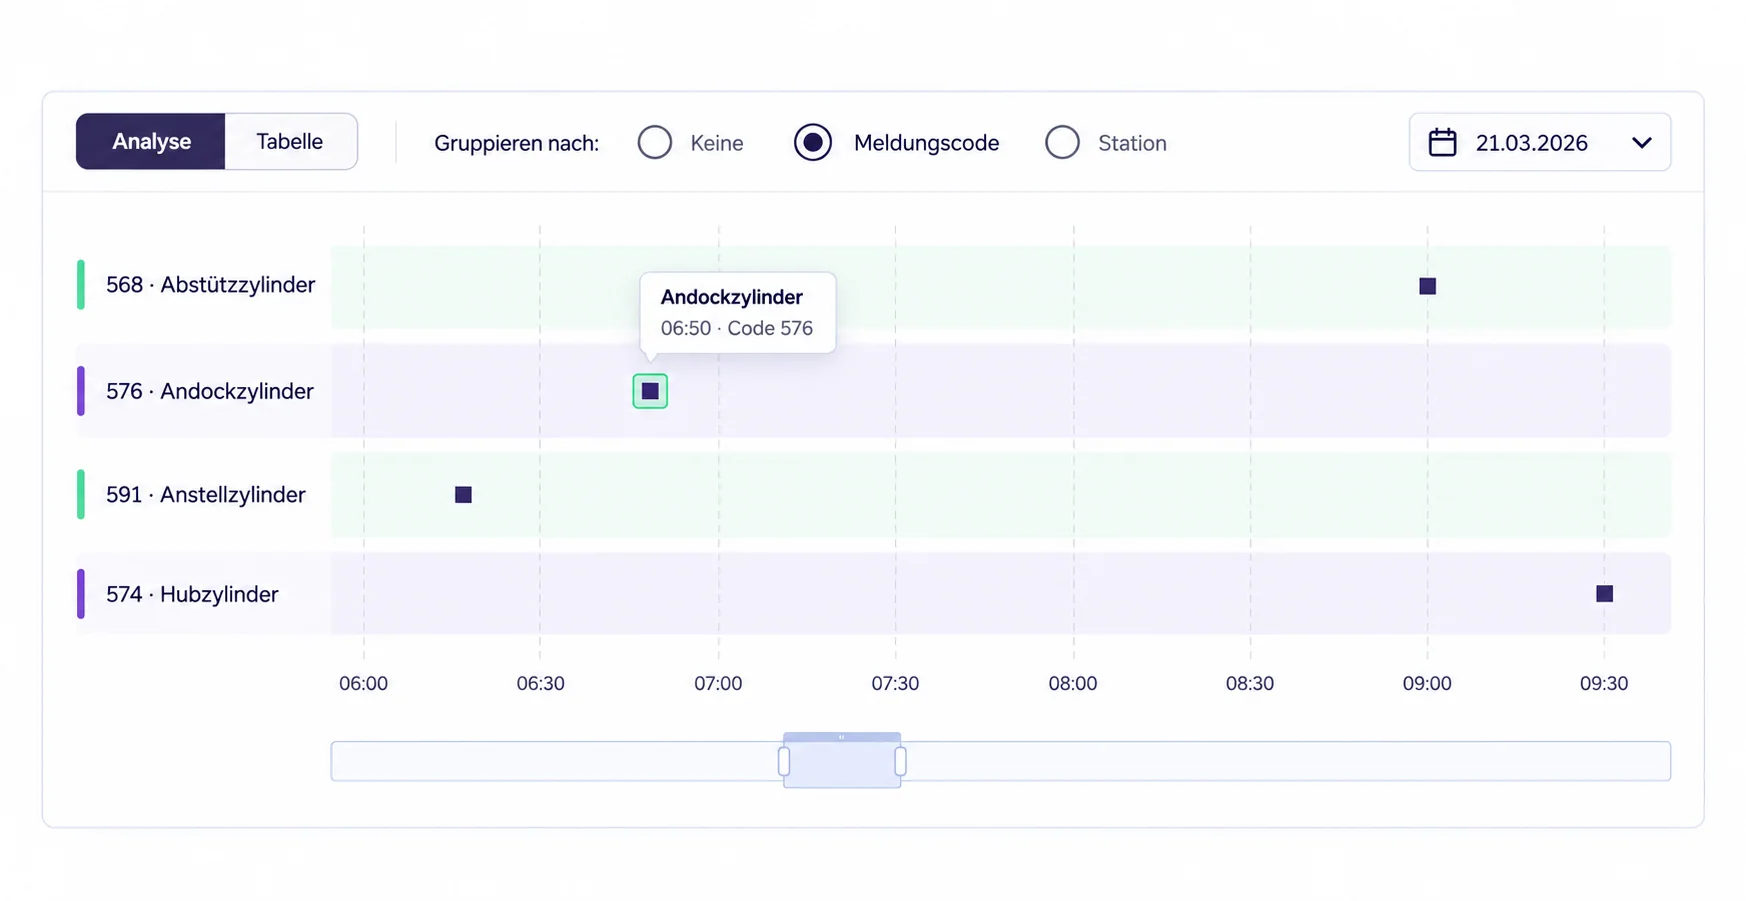
A message appears on the operator panel, is acknowledged, and disappears from view. Which messages recur during failures and how much downtime is associated with them often remains unclear. Manufacturing Insights systematically analyzes recorded errors and warnings and connects them with machine states and stoppage intervals.

  • Compare reports by frequency, duration, department, or time period
  • Open unusual stoppage intervals and examine the corresponding messages
  • Prioritize recurring patterns for investigation and maintenance
Explore message analysis
Message analysis showing the frequency and duration of recorded error messages

Initial situation

Where efficiency is typically lost

Production losses often result not from a single event, but from the interplay of process deviations, materials, tools, equipment condition, and a lack of context.

Typical challenges

These symptoms occur particularly frequently in efficiency projects in automated lines.

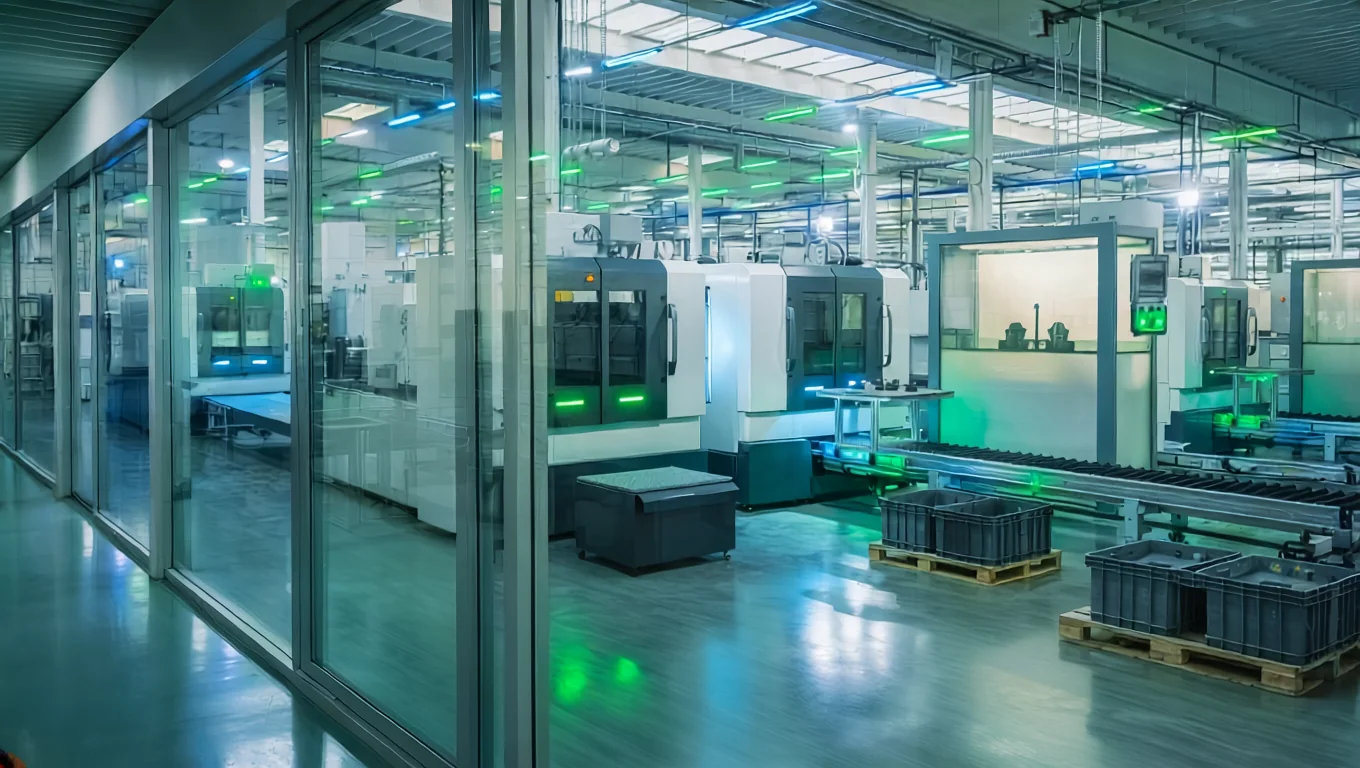
Automated production line with a machine operator
  1. 01

    Fluctuating performance level

    Losses in performance and quality often manifest themselves indirectly at first: through longer cycles, more rework or more frequent disruptions.

  2. 02

    Time-consuming troubleshooting

    With complex lines, it is difficult to trace which process steps, parameters or materials actually contributed to the deviation.

  3. 03

    Knowledge remains implicit

    Knowledge about typical patterns, threshold values, and measures often remains confined to individual minds.

Analysis approach

Example: From falling output to an action you can evaluate

Select the period with lower output. Compare machine states and open the error messages for unusual stoppage intervals. After taking action, check whether lost time and output improve under comparable production conditions.

  • Shared view of performance, quality and process behavior
  • Classification of patterns instead of isolated individual values
  • Basis for prioritized improvement measures
View Manufacturing Insights
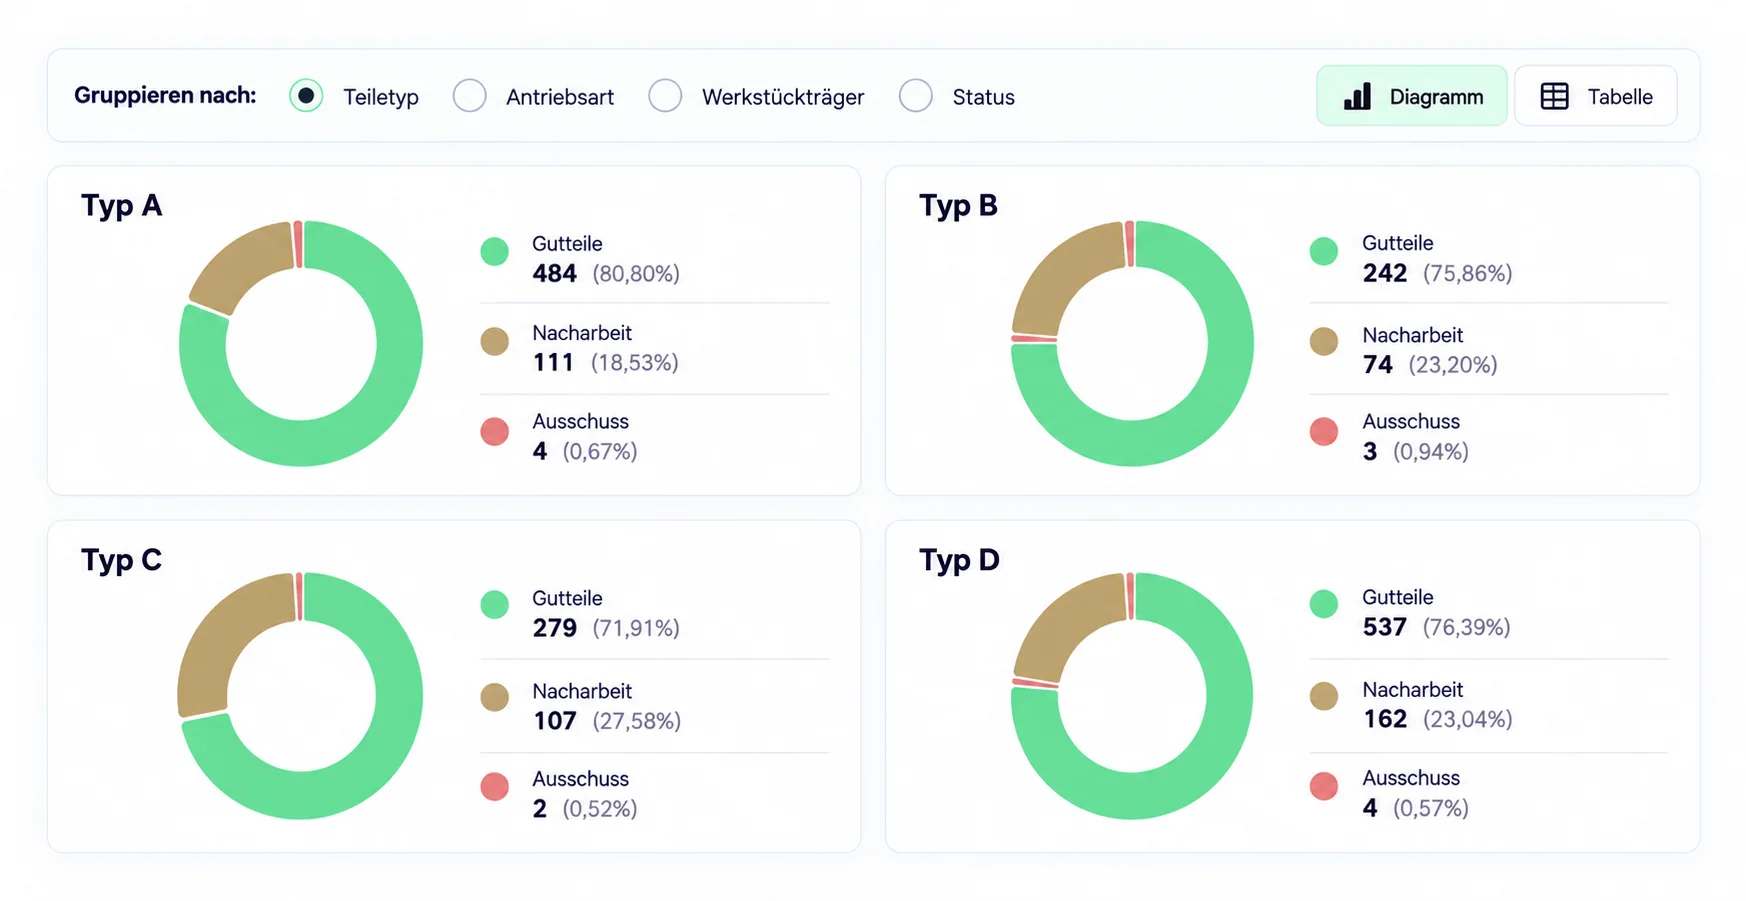
Analysis view of production efficiency

Analysis modules for improving efficiency

Depending on the line and data situation, different forms of evaluation are used to narrow down the causes more quickly.

Output and quality

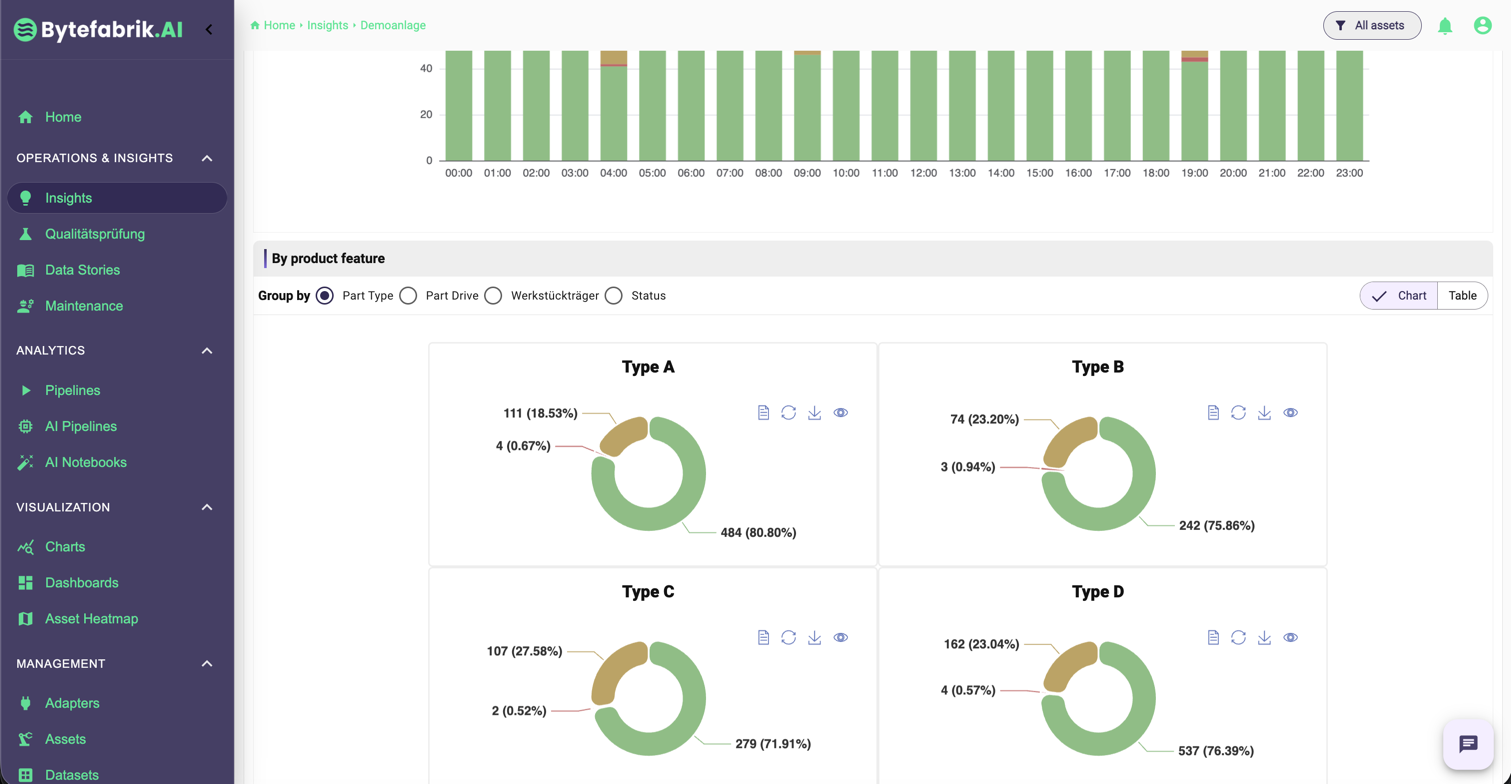
  • Good parts, rejects and reworkEvaluate quality events by line, station or time period.
  • Comparison by shift and productMaking performance differences visible in the production context.
  • Historical processesTrack developments over days, weeks or product changes.

Cycle and cycle time

  • Station-related cycle timesLimit bottlenecks and performance shifts down to process level.
  • Comparison via linesRecognize deviations between similar systems or layers.
  • Waiting and downtimeResolve non-value-adding times in the course and per station.

Process parameters

  • Force, temperature, torque, pressureEvaluate quality-relevant process values during production.
  • Trend and limit value analysisSystematically detect early signs of drift or wear.
  • Context by product or recipeParameters in connection with variants and product families.

Error patterns and OEE-related key figures

  • Message analysisEvaluate faults according to frequency, duration and ward context.
  • OEE-related viewsClassify availability, performance and quality in coherent views.
  • Product historyProvide histories and quality certificates for each part or batch.

Definition and KPIs

What production efficiency means

Production efficiency describes how effectively a machine converts available time, technical performance, and materials into good parts. The three OEE factors provide a starting point; for more in-depth root cause analyses, they are linked to machine states and process parameters derived from live machine data.

The three key factors

OEE = availability × performance × quality. The decisive next step is drilling down into the specific causes of loss.

  1. Availability

    Shows how much of the planned production time was actually available for manufacturing. Downtime and faults reduce this value.

  2. Performance

    Compares actual output or cycle time with the technically achievable target. Reduced speed and short interruptions become visible.

  3. Quality

    Relates good parts to total production. Scrap and rework are evaluated together with their process conditions.

Knowledge ArticlesUnderstand and improve production efficiencyDefinition, key metrics, common causes of loss, and the data-driven approach—from OEE variances to verifiable improvements.

Improve production efficiency systematically

The improvement process combines reliable KPIs with root-cause analysis and a verifiable before-and-after comparison.

  1. 01Fairs

    Make losses measurable

    Define the relevant loss metric and a reference period for one line, such as downtime, rework, or output.

  2. 02Analyze

    Narrow down root causes

    Investigate anomalies by line, station, product, shift and process parameter instead of comparing aggregated KPIs alone.

  3. 03Improve

    Prioritize actions

    Evaluate improvements by loss magnitude, frequency and technical feasibility, then begin with the greatest leverage.

  4. 04Scale

    Verify the impact

    Compare before and after under comparable product mix and operating conditions. Check whether the action works or shifts losses elsewhere.

Ready-made analytics within one platform

Matching modules

Manufacturing Insights provides ready-made manufacturing analytics; the IoT Data Hub handles connectivity, processing, and storage. Select views to match the loss you want to investigate.

Further solutions

These modules supplement the efficiency view with additional analysis perspectives.

Manufacturing Insights with Output and Quality Analysis
01

Manufacturing Insights

The IoT Data Hub extension with ready-made analyses for output, machine states, process parameters, errors, and part histories.

View Manufacturing Insights

Start a pilot with a specific production loss question

For example: Which recurring stops cost the most time? Within a few days to weeks, we set up a line and the appropriate loss analysis. Scope and data availability determine the timeline.

  1. 01

    Connect the first data sources in a workshop

    We'll work with you to select a system and a specific loss scenario. We'll connect the initial data sources directly during the workshop.

  2. 02

    Configure equipment and analysis views

    We configure the IoT Data Hub and the relevant Manufacturing Insights modules. States, errors, and the required product or process data are mapped.

  3. 03

    Evaluate the use case with your team

    With customized views, you can identify production losses early on. We evaluate the benefits based on the agreed-upon goals.

30-minute product demo

Which production loss will you tackle first?

In 30 minutes, we'll show you how your team can prioritize loss patterns, analyze periods of downtime, and evaluate comparison periods—all without any preparation.

Request a 30-minute demo