Prebuilt manufacturing analytics
Production analysis, error analysis, process analysis, product lifecycle, and OEE directly from machine data.
→
Manufacturing Insights
With add-ons for plant analysis, fault analysis, machine status, and more, Manufacturing Insights helps not only understand production issues but also resolve them in a targeted manner. Instead of generic dashboards, production staff have access to views tailored to their specific needs on a daily basis.
Manufacturing Insights is aimed at production, quality, and maintenance staff who want to investigate production losses.
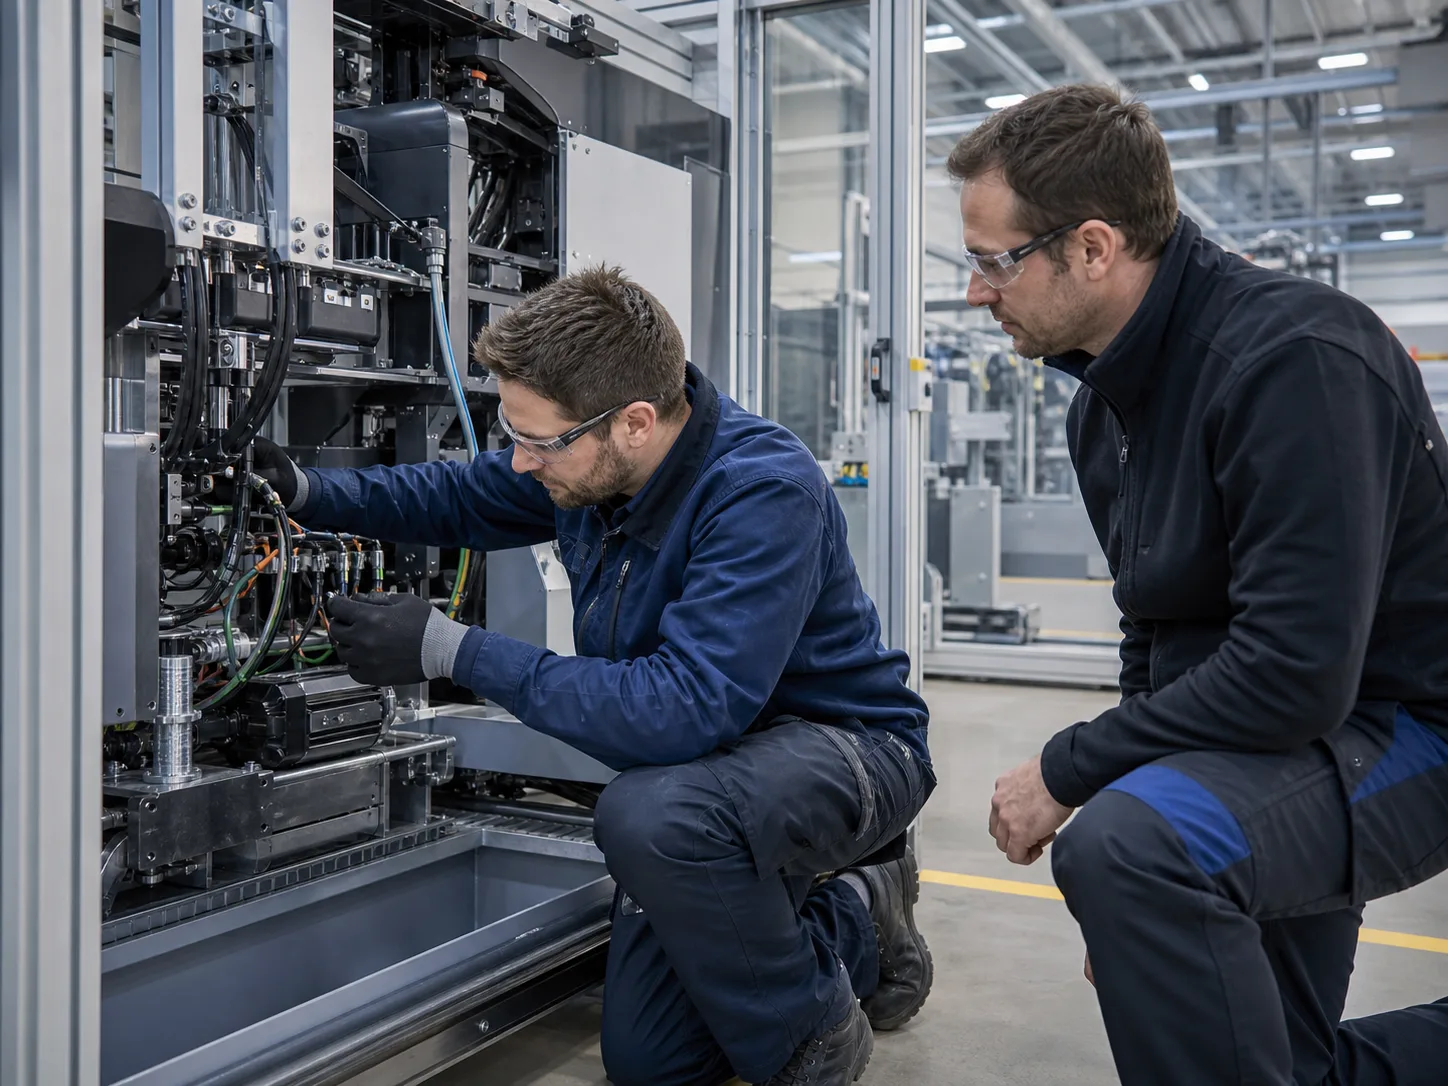
OEE, output, or scrap reveal a deviation. However, detailed data is often lacking to interpret the results.
Machine statuses, error messages, process values, and quality information are evaluated separately or compiled manually.
It remains unclear which error messages recur during outages and how long the system remains idle as a result. Without a detailed analysis, there is no basis for prioritizing relevant failure patterns.
Without a comprehensive before-and-after analysis, it remains unclear whether a measure has a lasting effect or merely shifts losses.
The team investigates the affected period, compares stations, and checks the errors recorded during a stoppage. The analysis provides evidence for an action whose effect can then be assessed using production data.
Compare line output and production KPIs over time.
Select the affected period and investigate lost time in the machine states.
Open a notable deviation and examine, for example, plant notifications or process parameters.
Define an action and reassess KPIs under comparable production conditions.
Plant analysis brings together output, cycle times, process parameters, and station KPIs. Error analysis, machine states, process analysis, and part history extend the investigation with the relevant data and filters.
Analyze error codes, warnings, and downtime by frequency, duration, station, and time period to identify relevant loss patterns.
Top Errors · Time Clusters · Ward-Specific Data
View Analysis Area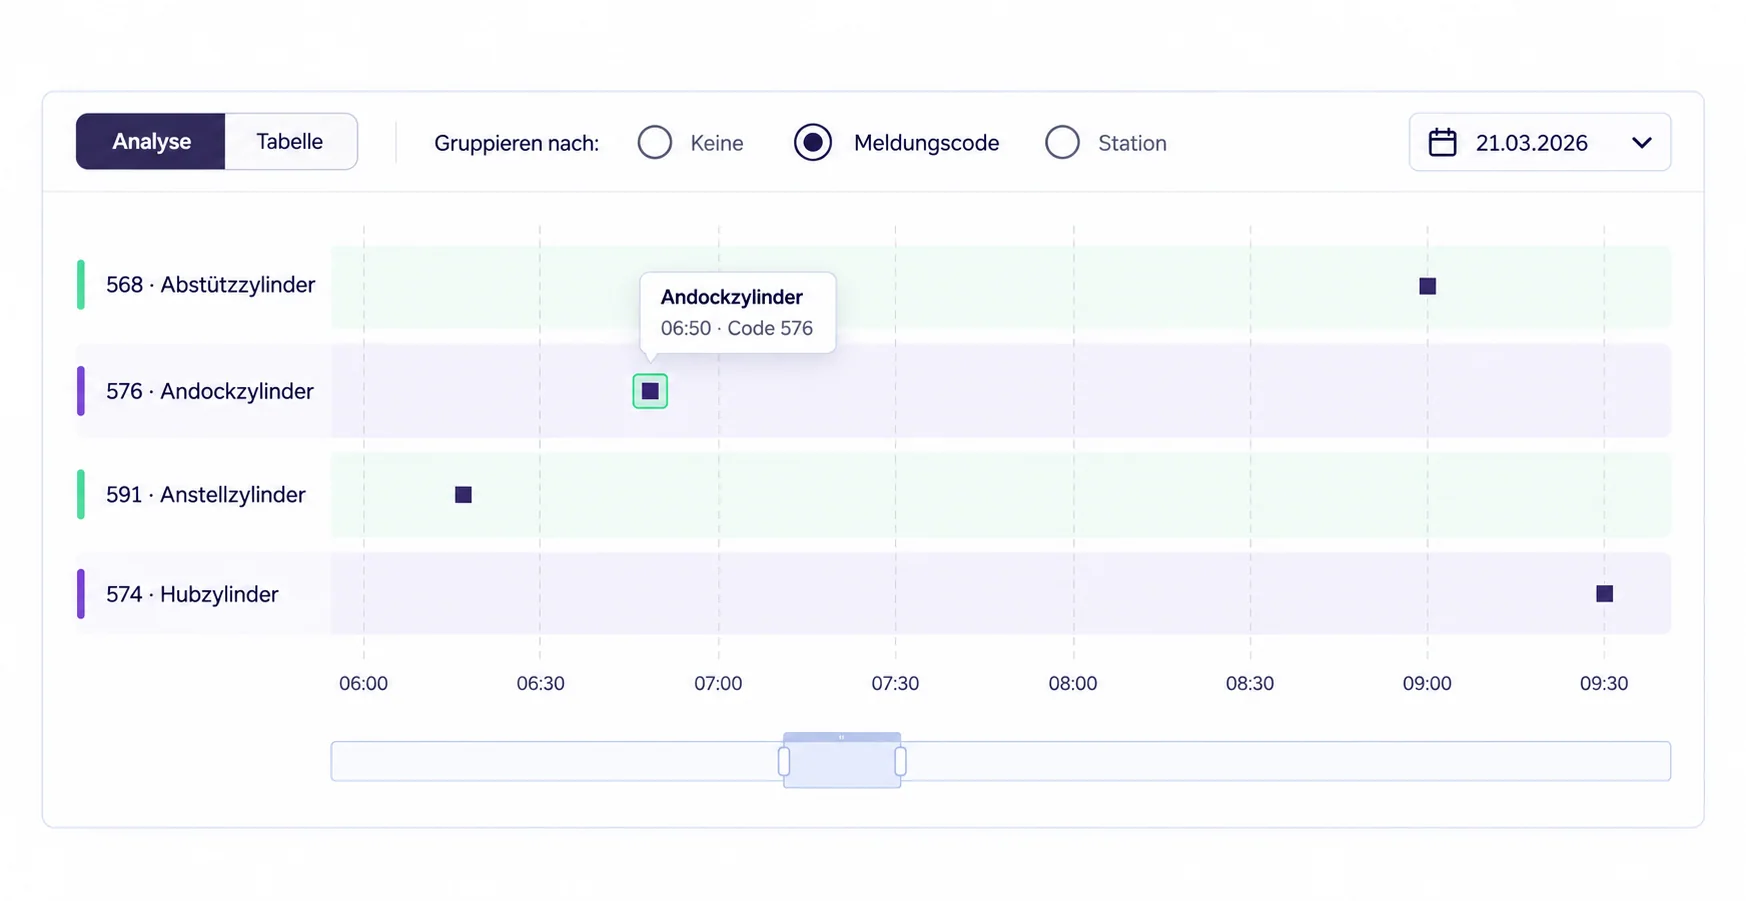
Plant managers and process engineers receive the details they need to achieve real cost savings, faster commissioning, and on-schedule ramp-up.
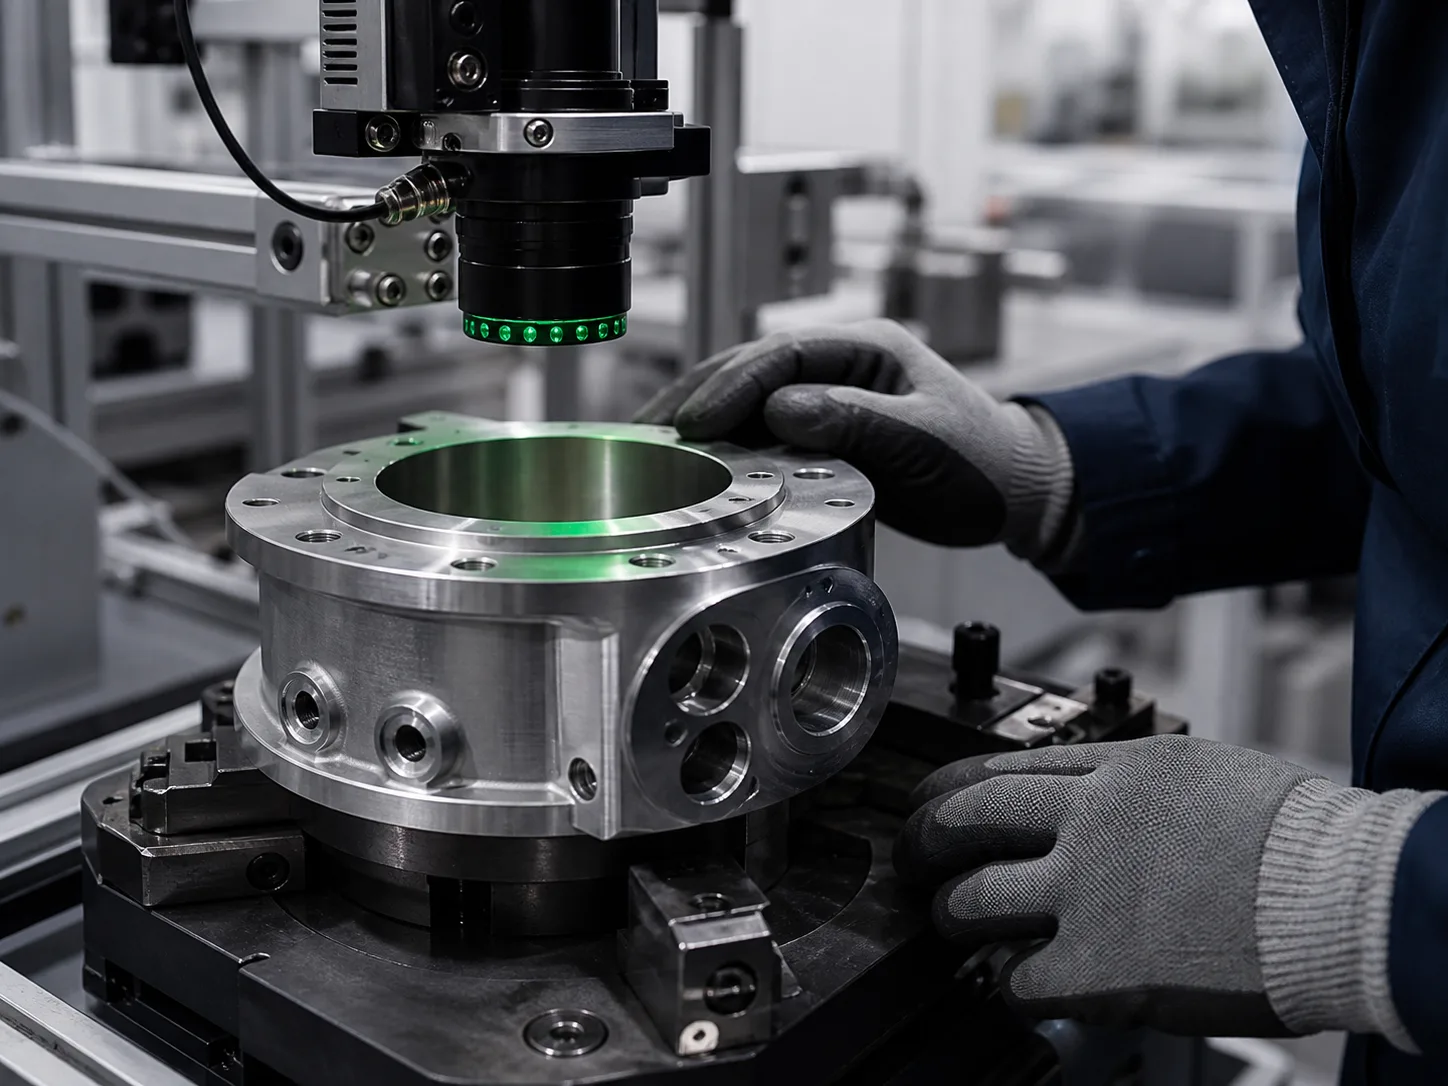
Manufacturing Insights is an add-on for the IoT Data Hub. You can leverage the data infrastructure and configure manufacturing analytics tailored to your needs. Thanks to extensive configuration options, no in-house development is required.
Connectivity, history, asset and semantic models for machines, production lines, and locations.
View IoT Data HubFrequently Asked Questions Before Getting Started
No. The process begins with a clear question about what needs to be improved. From there, the signals and contexts that are actually needed are identified. Existing data can be used, and missing sources can be specifically supplemented.
No. Manufacturing Insights supplements existing systems with production-related analytics and integrates machine, process, quality, and product context for root cause analysis.
No. OEE and production metrics are potential starting points. The key added value lies in drilling down into machine statuses, error patterns, process parameters, and part histories.
Yes. The scope of the initiative, the areas for improvement, and the required data context can be limited initially. Proven models and analyses can then be applied to other areas.
The scope of the data and the analytical views are derived from the desired outcome. Proven models can then be applied to other lines and questions.
Together, we determine which deviation should be understood and which line, stations, or products are relevant to it.
Machine statuses, process values, error events, and product information are assigned to the specific technical issue.
The relevant key metrics, drill-downs, and comparison views are reviewed within the context of production, quality, or maintenance.
Findings and measures are tracked using the same data set. Proven models can be applied to other lines or issues.
30-minute product demo
In 30 minutes, we'll trace a production variance by analyzing equipment, machine statuses, and error messages. You'll see how your team can pinpoint patterns of loss and what data is needed to do so—all without any preparation.
Built on an open IIoT data platform